
U.S. Semiconductors · Valuation Deep Dive
Micron —
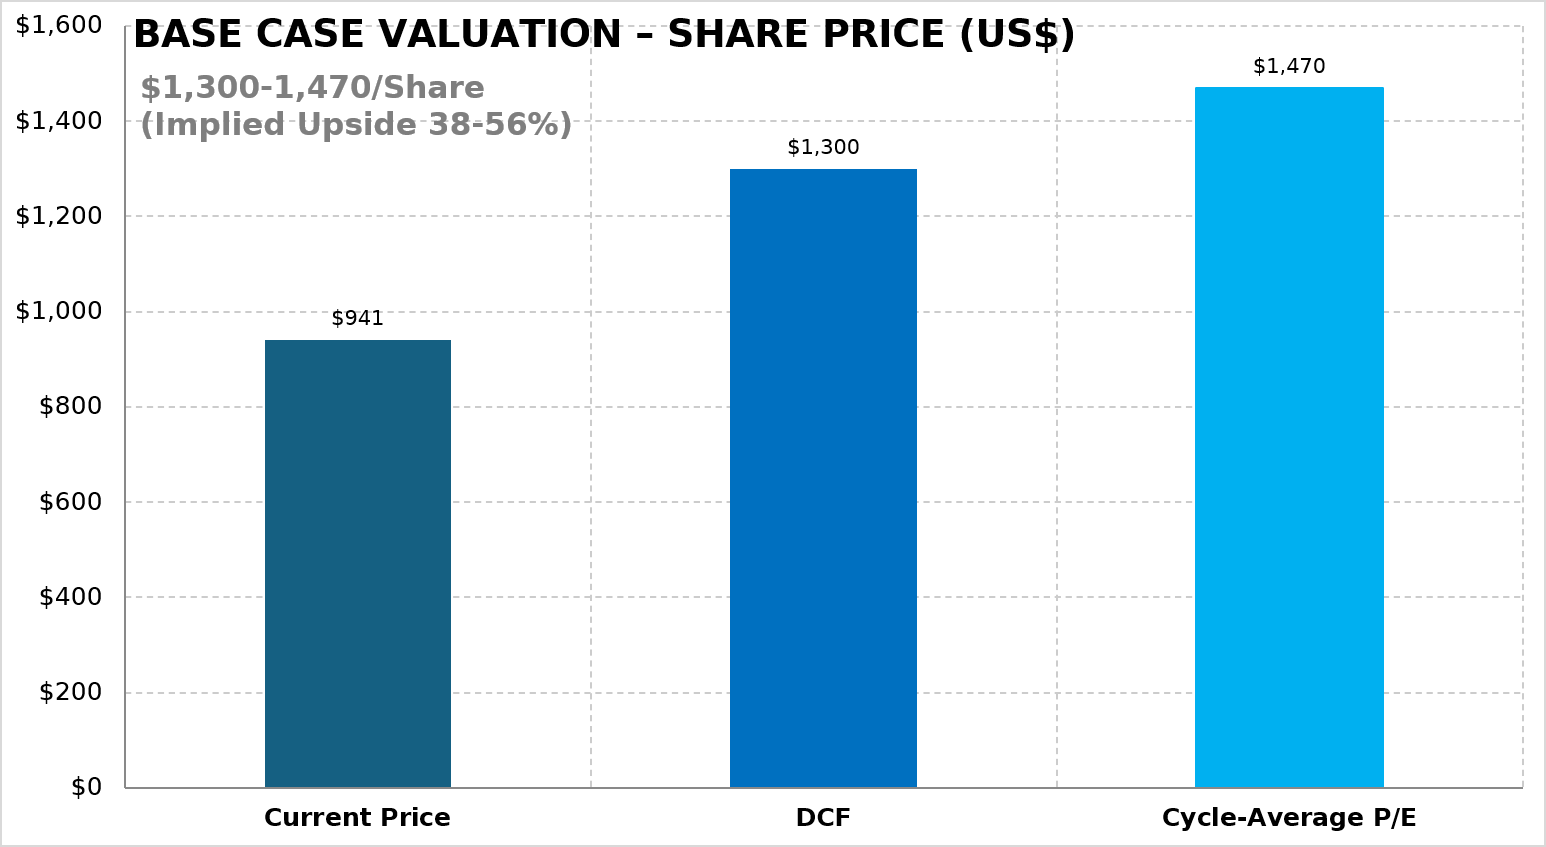
even after modeling a real downcycle, I still get $1,300–$1,470
I wanted to see what Micron is actually worth if I stop looking only at peak FY27 earnings and explicitly model the next memory downcycle. So I rebuilt the valuation from scratch. The result: about $1,300/share from DCF and about $1,470/share from FY27–31 cycle-average earnings — even though my Base case assumes gross margin falls from 87% to a 60% trough by FY30.
I wanted to see what Micron is actually worth if I stop looking only at peak FY27 earnings and explicitly model the next memory downcycle.
So I rebuilt the valuation from scratch. This is my own analysis and valuation work — not investment advice.
I’ve tried to stay fairly conservative with the assumptions.
The result
So the thesis is not that today's extraordinary margins last forever.
It is that the next trough may be structurally higher — and less destructive — than the memory cycles investors are used to.
1. Peak earnings are not the real debate
Micron's current numbers are extraordinary.
Fiscal Q3 revenue reached $41.46B, non-GAAP gross margin hit 84.9%, and non-GAAP EPS came in at $25.11. For fiscal Q4, management is guiding to roughly $50B of revenue, 86% gross margin and $31 of EPS. My FY27 Base is $267B of revenue, 87% GM and about $166 of EPS.
That sounds aggressive until you compare it with the Street.
| FY27 estimate | Revenue | EPS |
|---|---|---|
| My Base | $267B | ~$166 |
| Morgan Stanley | ~$266.9B | ~$168.5 |
| Barclays | ~$267.4B | ~$166.7 |
| UBS | — | ~$184.9 |
In other words, FY27 is not where I am taking the heroic view. Morgan Stanley is almost exactly on my revenue and EPS. Barclays is similar. UBS is materially above me.
Micron's own commentary has become more bullish as well. At the August KeyBanc conference, management said customer demand signals had strengthened further and that calendar 2027 could be even tighter than 2026, because demand growth is running faster than supply growth.
That is why I think obsessing over whether FY27 EPS is $160, $166 or $175 misses the bigger issue.
2. Why this cycle may actually be different
Memory has not stopped being cyclical. High prices still encourage capacity. Capacity eventually catches demand. Pricing weakens. Margins compress.
That mechanism is alive and well.
The question is whether several structural changes have altered the severity of the next downturn. I think three deserve particular attention.
Strategic Customer Agreements
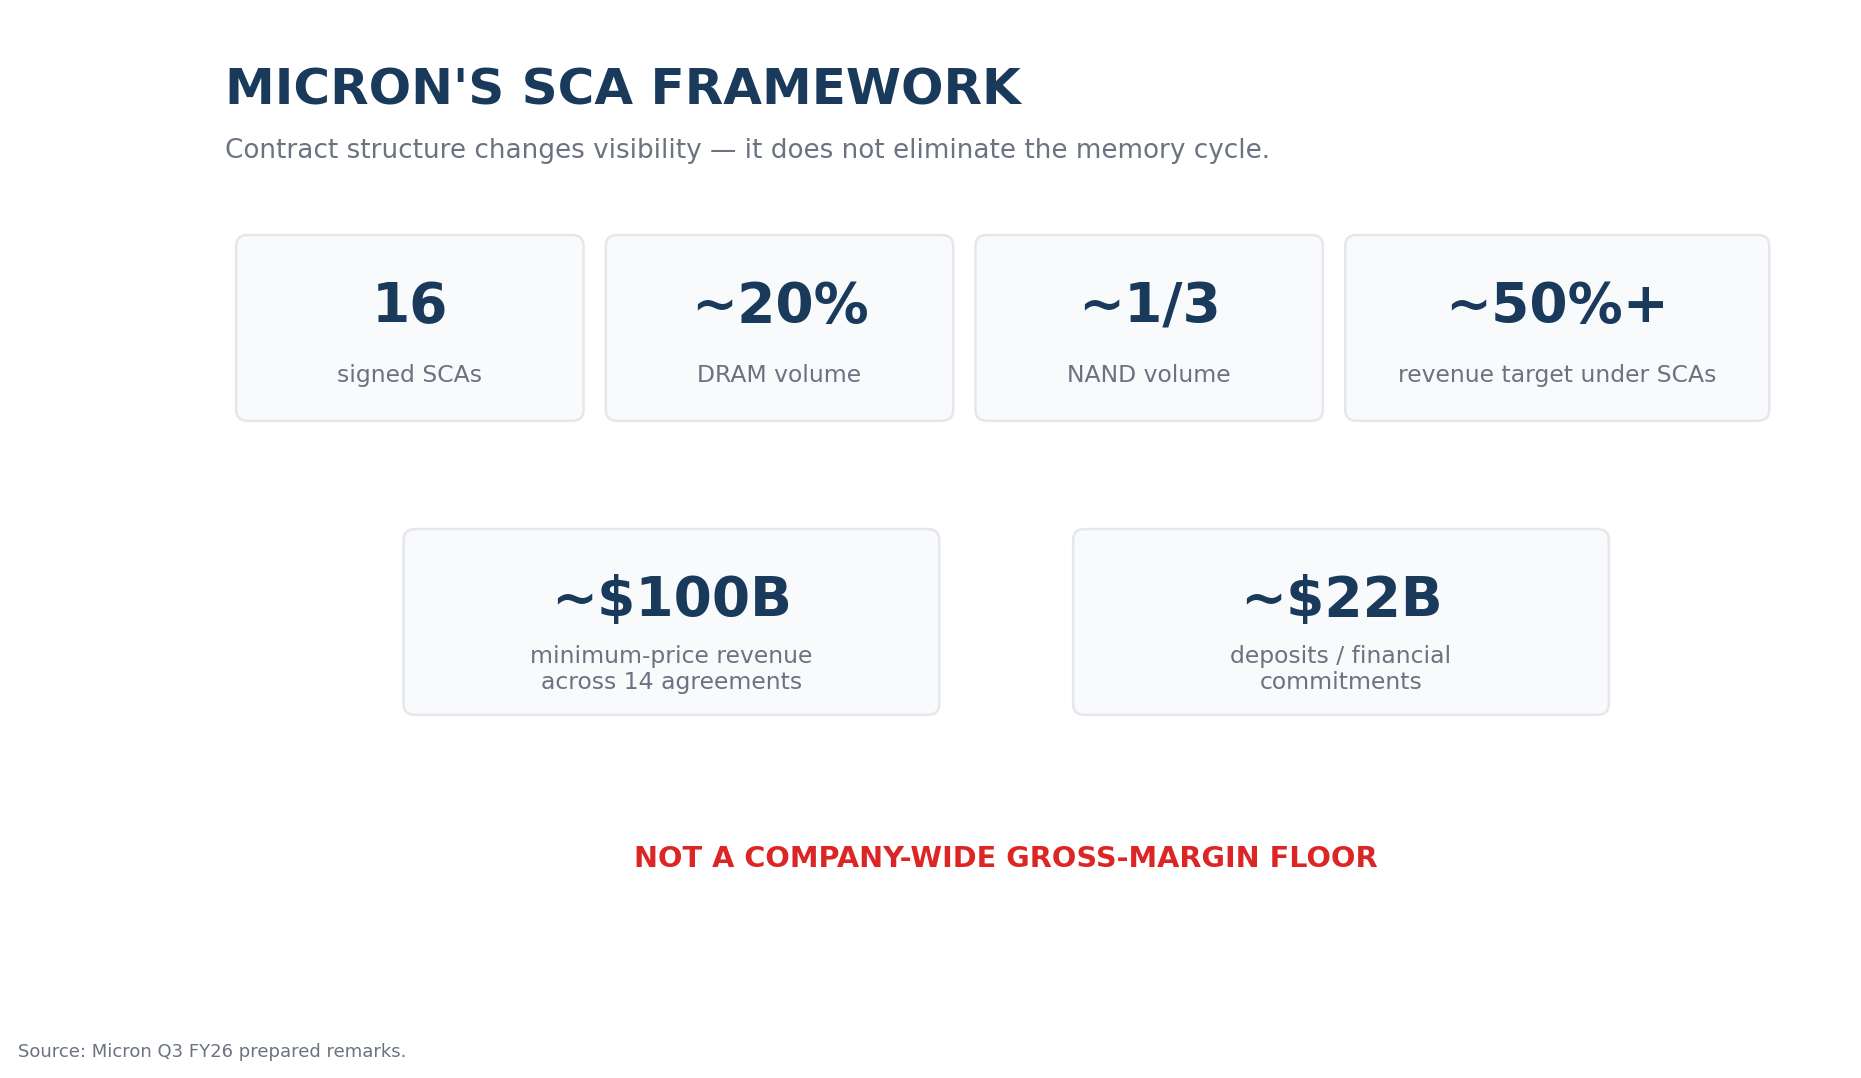
Micron has now signed 16 Strategic Customer Agreements, or SCAs, covering a meaningful portion of future DRAM and NAND demand.
The headline numbers are substantial — including roughly $100B of cumulative minimum-price revenue across 14 agreements and significant customer deposits and commitments.
But the more important point is what those contracts may do to the cycle.
Micron has also said that price-band SCAs can still generate strong gross margins even at the contractual floor.
That does not mean Micron has created a company-wide gross-margin floor. Only part of the business is covered, contract structures differ, and most of the current agreements run through calendar 2030.
My interpretation is narrower: SCAs may make the next downturn less severe than previous memory cycles.
HBM changes the supply equation
HBM is usually discussed as a premium product.
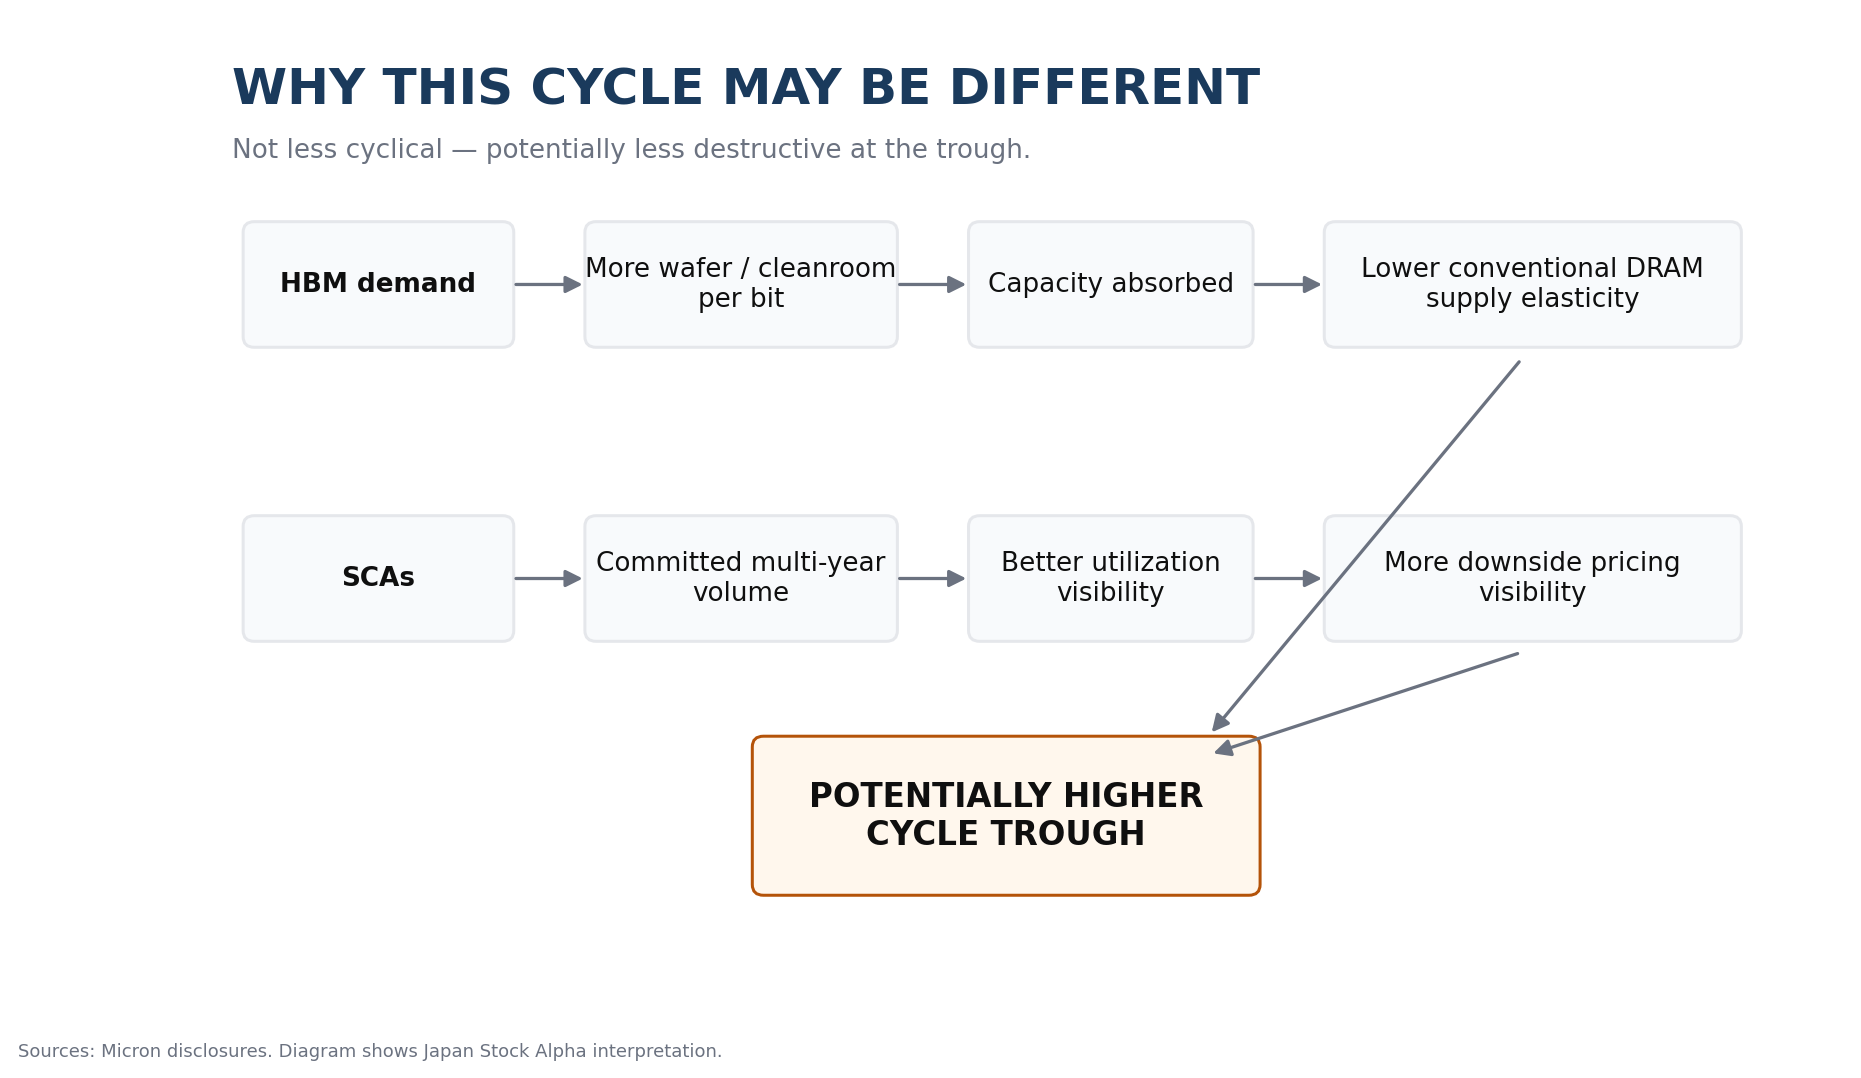
I think the more important point is that it changes supply elasticity.
Micron itself says HBM requires more wafers and more cleanroom space to produce the same number of bits as conventional DRAM.
This is one reason the AI memory cycle can spill over into ordinary DRAM economics.
It can also reverse. If HBM demand weakens and suppliers redirect capacity back into conventional DRAM, supply can increase quickly and pricing can fall.
That is not a footnote. It is probably one of the cleanest downside transmission mechanisms in the entire thesis.
The balance sheet is much stronger
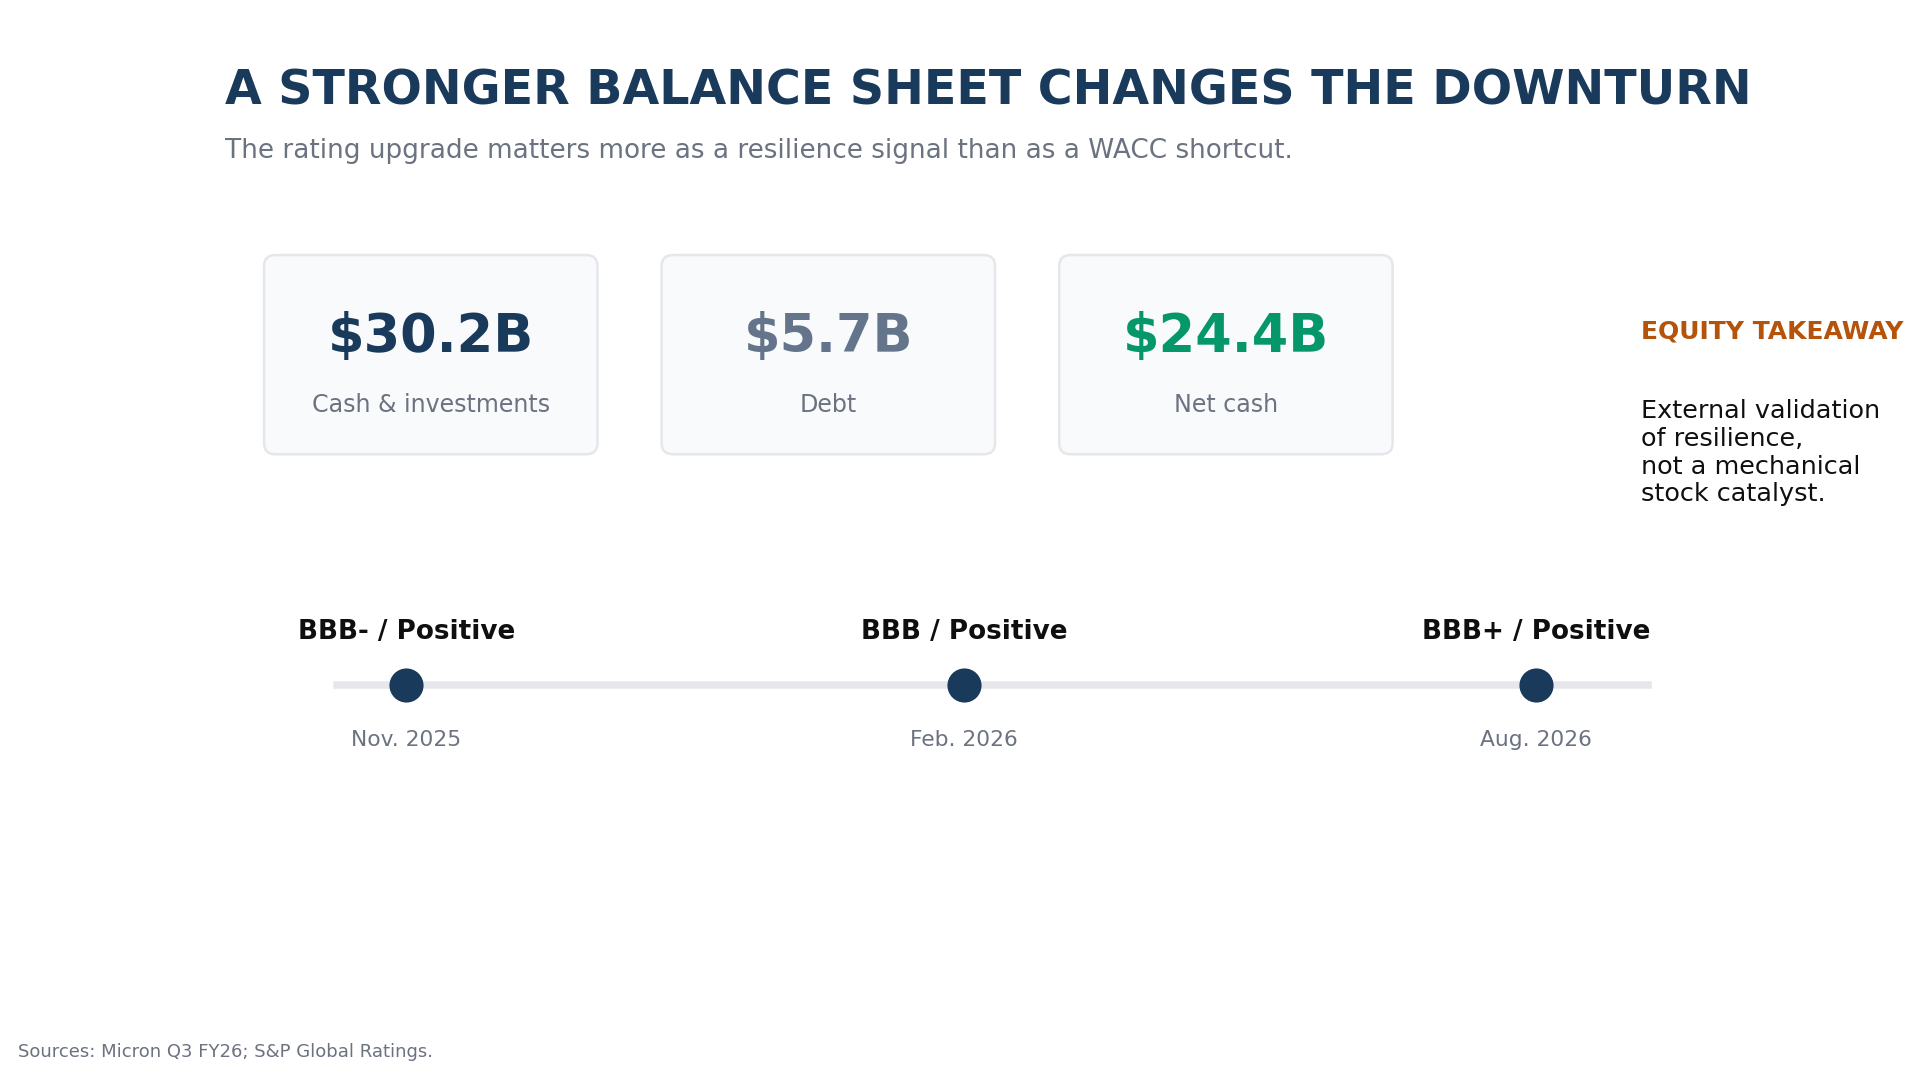
At the end of fiscal Q3, Micron had approximately:
- $30.2B of cash and investments
- $5.7B of debt
- $24.4B of net cash
For a deeply cyclical, capital-intensive semiconductor company, that matters. A memory downturn is much more dangerous when the company enters it with high leverage and a large capex program that still has to be funded.
Micron is approaching the next cycle from a much stronger financial position.
This is not a thesis that Micron has become non-cyclical.
It is a thesis that the next trough may be less destructive.
3. The credit market is noticing too
On August 19, S&P Global Ratings raised Micron to BBB+ with a Positive outlook, from BBB.
The direct equity impact is easy to exaggerate. Micron has little net financial leverage, so moving from BBB to BBB+ does not suddenly take hundreds of basis points out of my WACC.
That is not why I care.
I care about what the rating action says about resilience.
When S&P upgraded Micron to BBB earlier this year, it highlighted AI-driven improvement in scale, EBITDA and cash flow, Micron's strong balance sheet, and the possibility that operating metrics could become less volatile if AI memory demand continues to outpace the industry's ability to add supply.
S&P was careful not to declare cyclicality dead. It explicitly kept severe AI-demand and memory-downturn risks in the framework.
The rating upgrade is not a direct stock catalyst. It is external validation that Micron's financial profile is stronger going into the next cycle.
There is also a second-order implication:
4. What are institutions actually debating?
The bigger disagreement is what happens after FY27. More specifically: how low margins fall in the next downturn.
Morningstar remains firmly in the traditional-cycle camp. It still expects a major downturn around 2029 and sees long-term gross margins in the 40–50% range.
Bernstein's earlier cycle work took a different route but reached a similar warning on duration: it modeled Micron GM falling from roughly 85.5% in FY27 to 70.3% in FY28. That forecast is now dated on absolute earnings, but the philosophy is still relevant — once supply catches up, extraordinary margins can normalize fast.
UBS sits much further toward the structural-reset camp. Timothy Arcuri has interpreted Micron's SCA economics as consistent with roughly 70–75% gross margins, well below the current peak but far above old-cycle economics.
- Morningstar is describing long-term economics.
- Bernstein published an explicit FY28 forecast.
- UBS's 70–75% is an analyst interpretation of sustainable economics.
- My 60% is a modeled cyclical trough, not a permanent margin.
Still, the range tells you what the market is really arguing about.
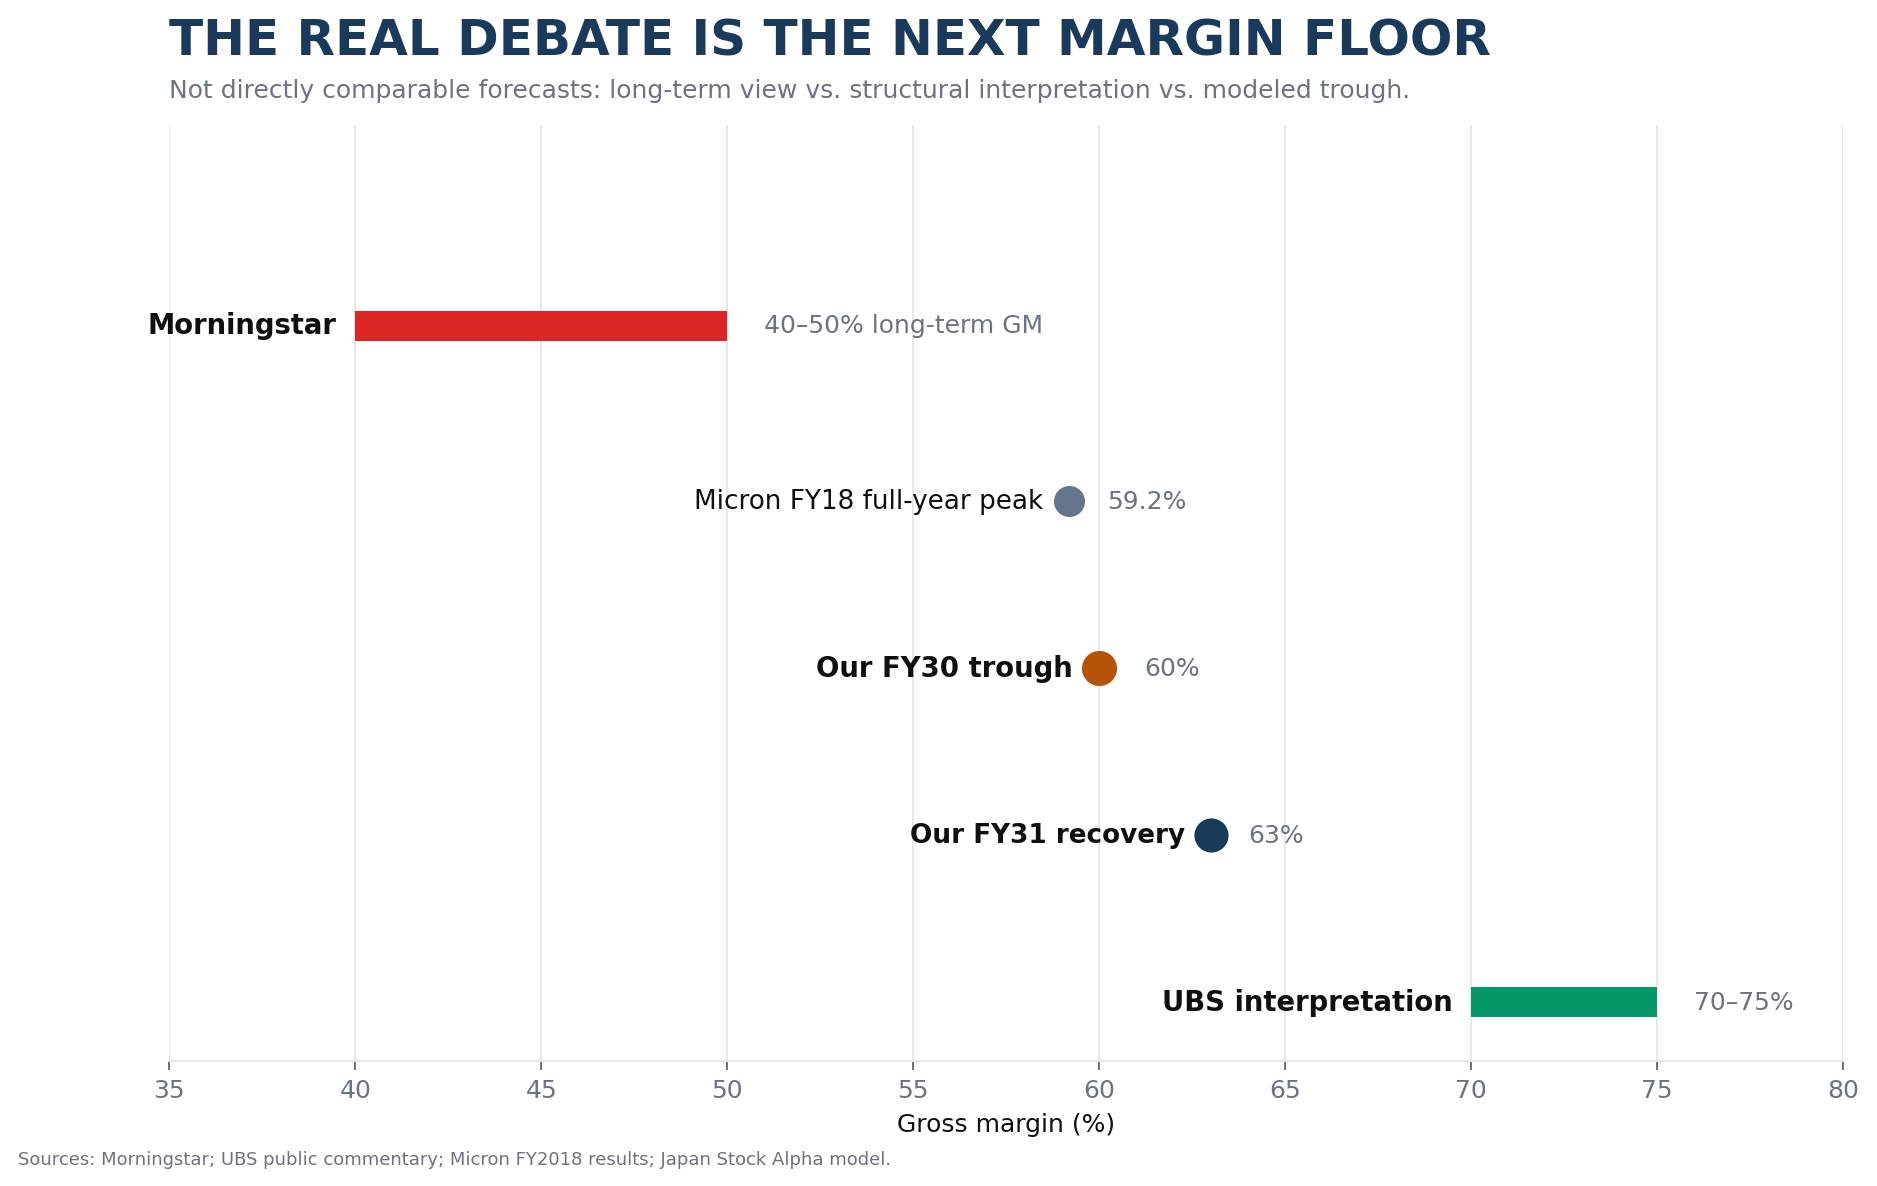
My model deliberately sits between the extremes. I do not assume Micron goes back to 40–50% immediately. I also do not underwrite a permanent 70–75% GM as Base.
5. My Base case: peak → downcycle → higher trough
Here is the model.
| Fiscal Year | Revenue | Gross Margin | EPS | FCFF |
|---|---|---|---|---|
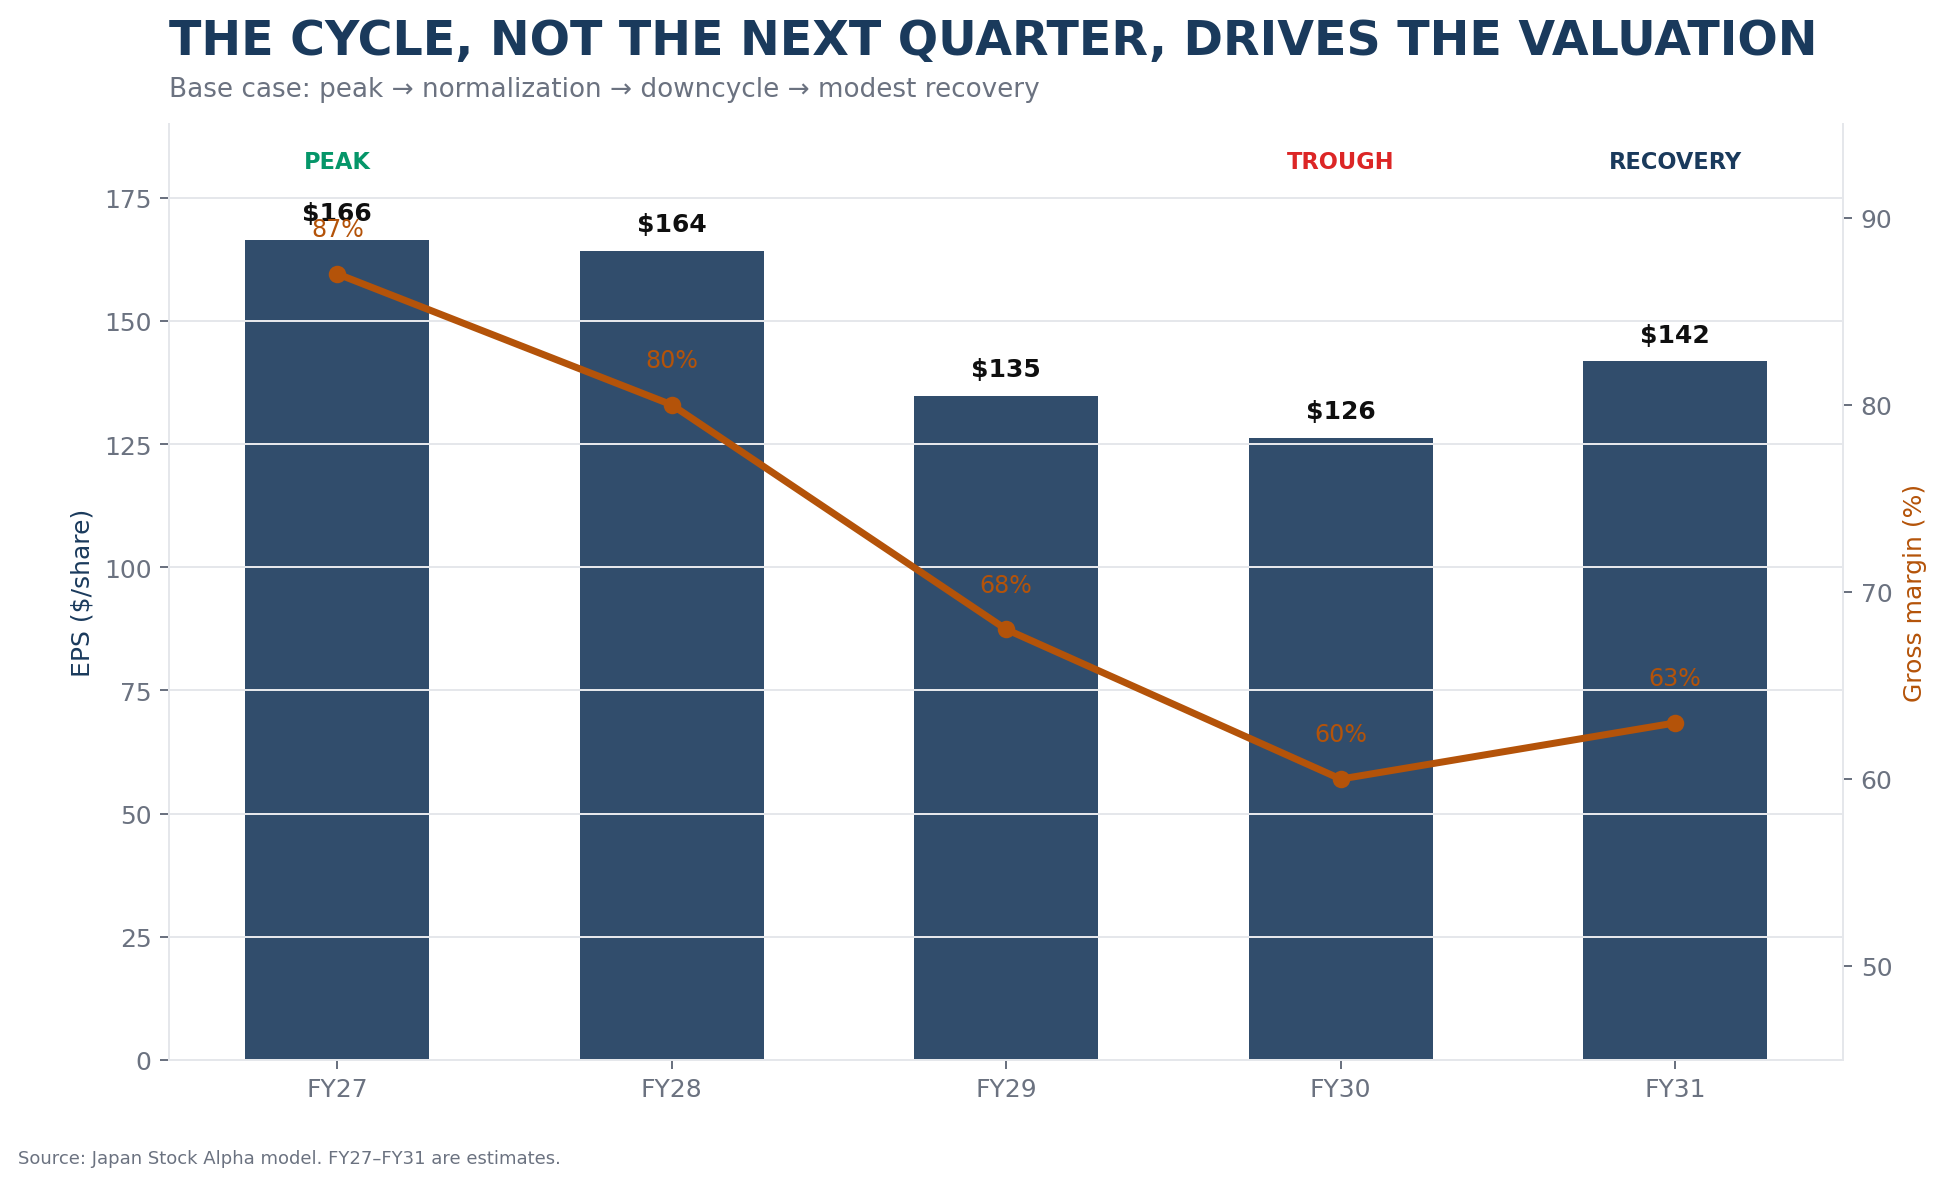
| FY27 | $267B | 87% | $166 | $149B |
| FY28 | $290B | 80% | $164 | $148B |
| FY29 | $285B | 68% | $135 | $119B |
| FY30 | $305B | 60% | $126 | $116B |
| FY31 | $325B | 63% | $142 | $139B |
The shape matters more than the exact annual number.
FY27: peak-like economics.
FY28: still very strong, but normalization starts.
FY29–30: a real downcycle. I even model revenue declining in FY29.
FY30: the modeled trough at 60% GM.
FY31: only a modest recovery to 63%.
Why 63%?
Because I do not think a cyclical trough should automatically become the permanent terminal state. But I also do not want to assume an aggressive snapback.
Micron's previous full-year non-GAAP GM peak was 59.2% in FY2018. So 63% is only modestly above the old full-year peak and still well below the 70–75% structural interpretation on the bullish side of the Street.
Meanwhile, the supply side gives me a reason to put the downcycle in FY29–30 rather than pretend tightness lasts forever. Micron expects first wafer output from Idaho ID1 in mid-calendar 2027, meaningful shipments from Tongluo around mid-2027, and ID2 output in late 2028. More industry capacity should matter increasingly from there.
6. What is that worth?
I use two valuation methods in parallel.
| Method | Key assumption | Implied value / share |
|---|---|---|
| DCF | 11.5% WACC / 3.0% terminal growth | ~$1,300 |
| Cycle-Average P/E | FY27–31 avg EPS ~ $147 × 10x | ~$1,470 |
DCF: ~$1,300
The cash-flow forecast is already shown in the Base Case above, so the key question here is what those cash flows are worth today.
| DCF assumption | Base |
|---|---|
| WACC | 11.5% |
| Terminal growth | 3.0% |
| Net cash | ~$24.4B |
| Diluted shares | ~1.15B |
| Implied value/share | ~$1,300 |
I also wanted to make sure the valuation was not being driven by an unusually favorable discount rate.
| WACC | DCF / Share |
|---|---|
| 11.5% | ~$1,300 |
| 12.0% | ~$1,230 |
| 12.5% | ~$1,170 |
Even at a 12.0–12.5% WACC, the DCF remains above the $940.76 price anchor used in this analysis.
Cycle-Average P/E: ~$1,470
For the earnings-based valuation, I use the full FY27–31 average EPS rather than simply applying a multiple to FY27 peak earnings.
| Fiscal Year | FY27 | FY28 | FY29 | FY30 | FY31 | Average |
|---|---|---|---|---|---|---|
| EPS | $166 | $164 | $135 | $126 | $142 | ~$147 |
That five-year period deliberately captures the full cycle I am modeling: peak → normalization → downcycle → trough → initial recovery.
That is why I think the ~$147 average is a more useful earnings base than FY27 alone.
| Cycle-Average P/E | Implied Value / Share |
|---|---|
| 9x | ~$1,320 |
| 10x | ~$1,470 |
| 11x | ~$1,610 |
My Base is 10x, which gives me approximately $1,470/share.
Cycle-average P/E: ~$1,470
My Base valuation range is therefore ~$1,300–$1,470/share.
The DCF asks what Micron's modeled cash flows are worth today. The P/E approach asks what investors might reasonably pay for earnings averaged across the modeled memory cycle.
Different methods, different assumptions — but both point to a value materially above the $940.76 price anchor used in this analysis.
And importantly, neither valuation requires Micron to sustain today's 85%+ gross margins indefinitely.
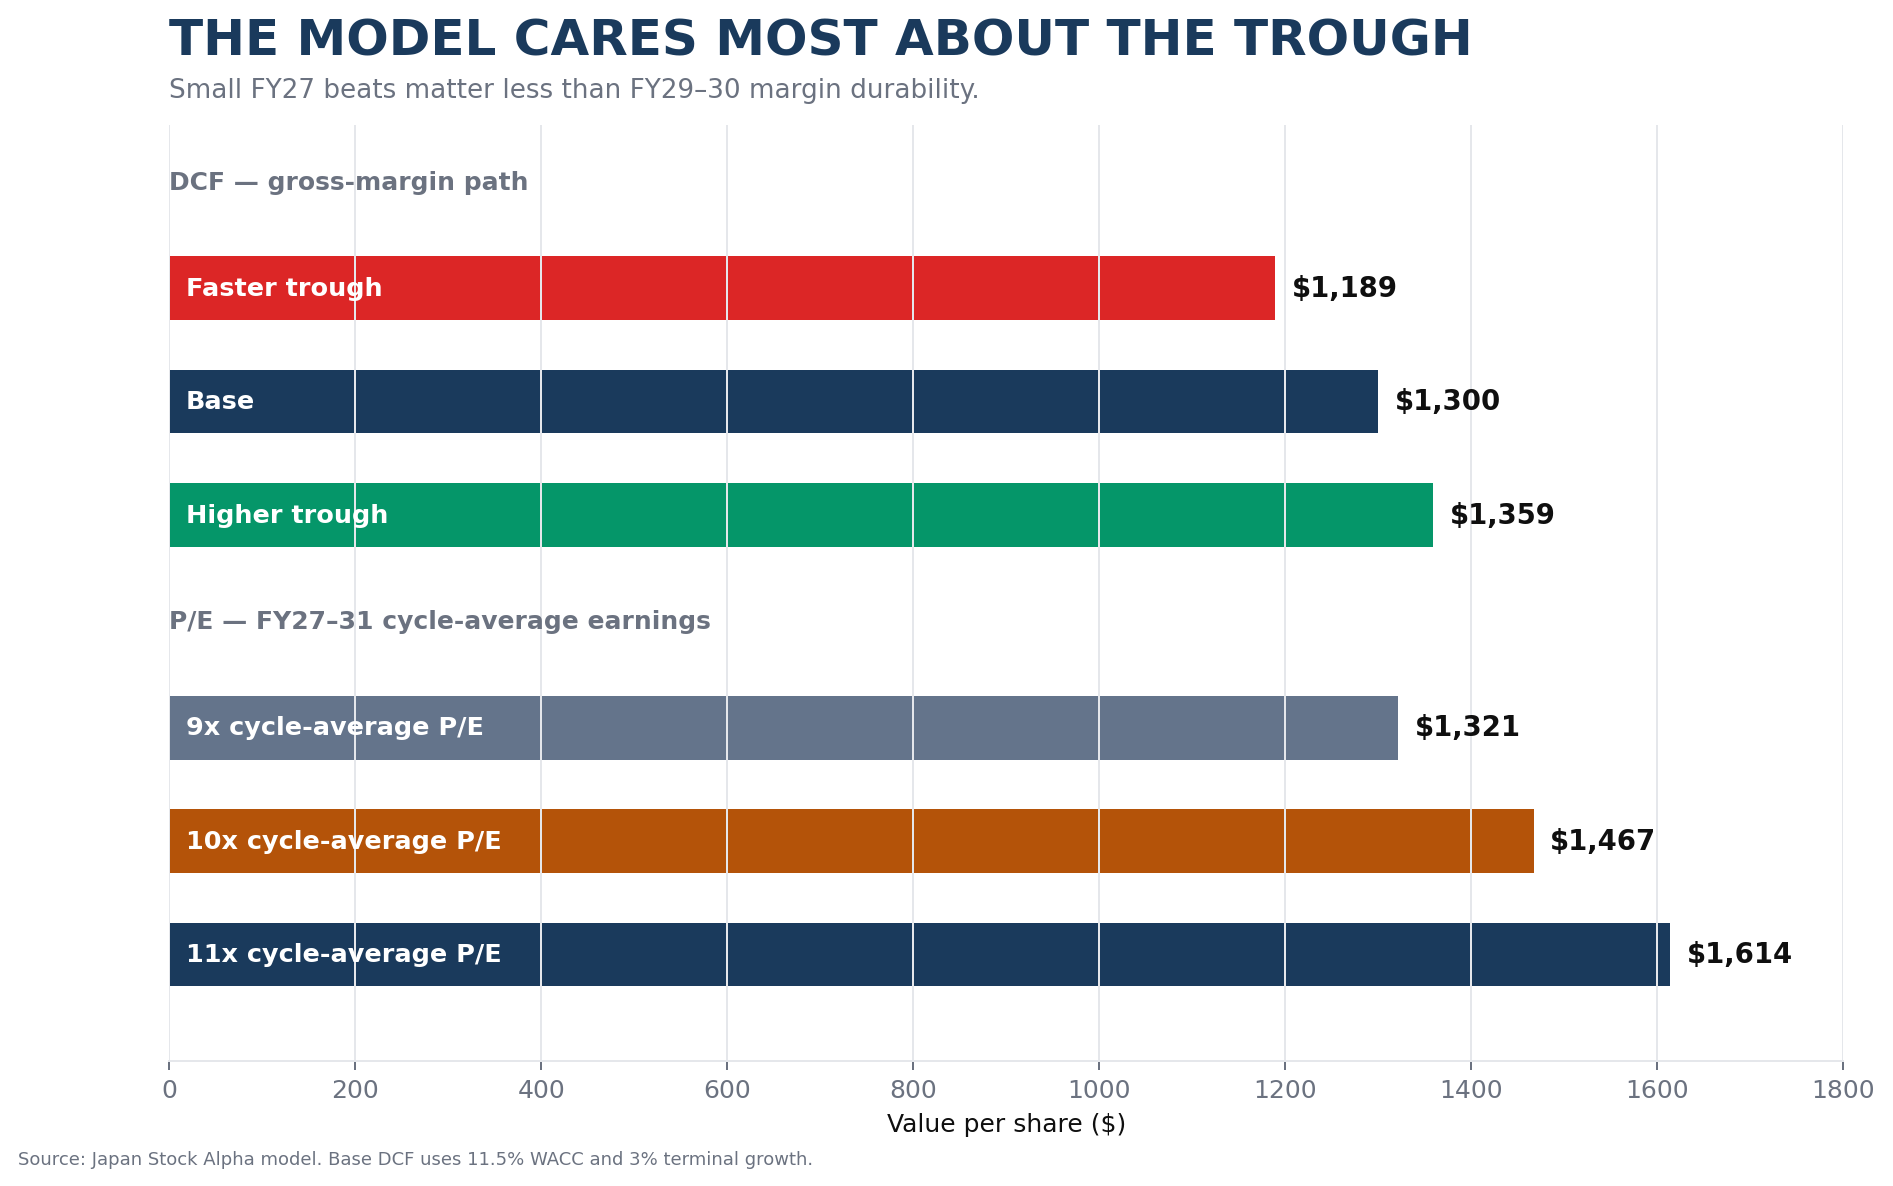
7. The most important sensitivity is not FY27
You can move FY27 revenue or GM around and change EPS by a few dollars. That matters for the next earnings print.
It matters much less for intrinsic value than the earnings duration.
| Margin path | FY27 → FY31 | DCF / Share |
|---|---|---|
| Faster trough | 87% → 77% → 62% → 55% → 58% | ~$1,190 |
| Base | 87% → 80% → 68% → 60% → 63% | ~$1,300 |
| Higher trough | 87% → 83% → 74% → 66% → 65% | ~$1,360 |
That is the core debate.
Not whether FY27 EPS is $162 or $170.
But whether FY29–30 GM is closer to 50%, 60% or 70%.
8. One upside I am not modeling: buybacks
Micron’s stronger balance sheet creates another source of optionality: capital returns.
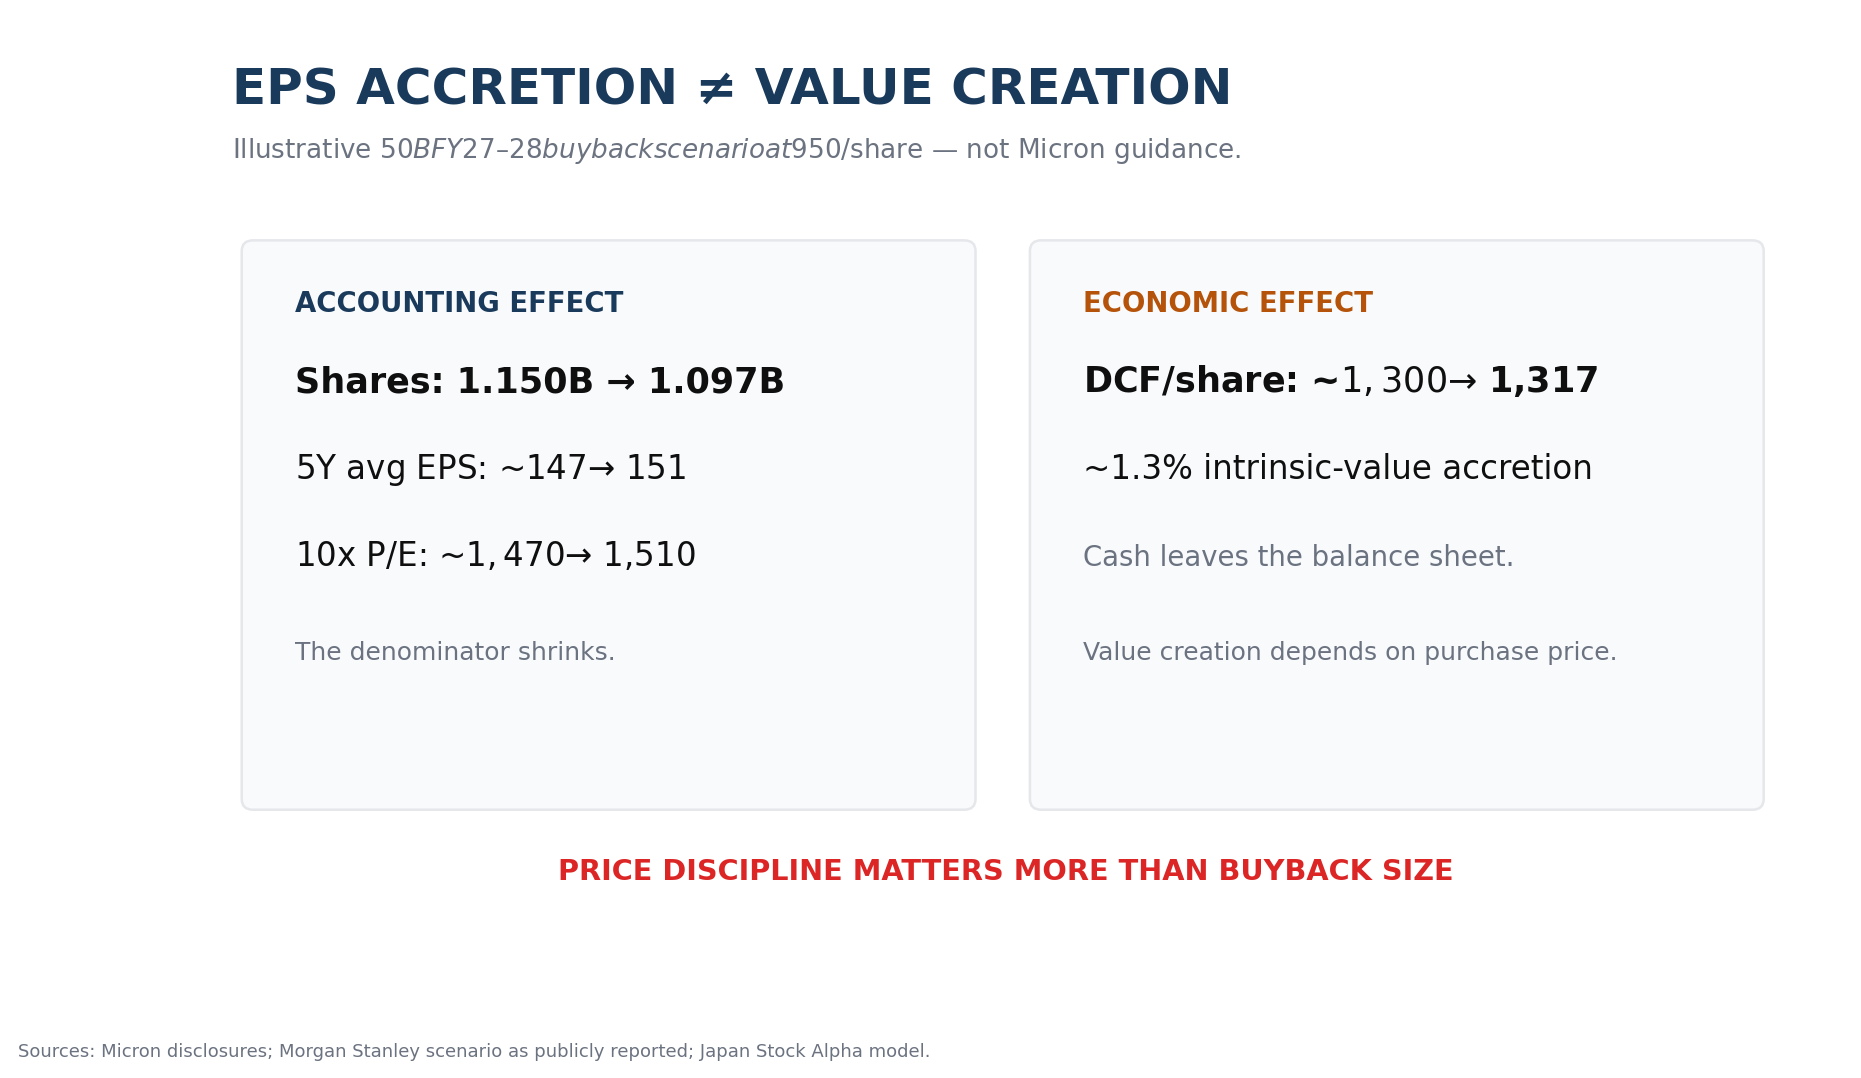
The company currently has only about $2.2B remaining under its existing repurchase authorization. Morgan Stanley has modeled a much larger buyback scenario for FY27–28, but that is not Micron guidance, and I do not include a major repurchase program in my Base valuation.
That distinction matters.
A buyback can increase EPS simply by reducing the share count. But EPS accretion is not automatically value creation — the price paid for the shares matters.
If Micron eventually uses excess cash to repurchase stock materially below intrinsic value, I would view that as incremental upside to the per-share economics.
9. What would make me wrong?
Conclusion
The easiest way to call Micron cheap today is to take peak FY27 EPS, apply a multiple and stop there.
I do not think that is good enough for a memory stock.
So I made the Base case harder.
I assume a real downturn.
Gross margin falls from 87% to 60%.
EPS falls from about $166 to $126.
Revenue actually declines in FY29.
And even after doing that:
while
FY27–31 cycle-average EPS at 10x gives me roughly $1,470
against the $940.76 Aug. 18 price anchor used in this analysis.
The stock does not need 85% gross margins forever.
It needs the next trough to be less destructive than the old ones.
SCAs provide more contractual visibility.
HBM absorbs more supply capacity per bit.
The balance sheet is dramatically stronger.
And S&P's move to BBB+ / Positive is another piece of evidence that Micron's financial resilience is improving — even if it is not a direct equity catalyst.
None of that eliminates the memory cycle.
But it may change the economics of the next one.
At the price anchor used here, I think the risk/reward remains attractive.
Let's see how it goes.
Micron Q3 FY26 earnings release and prepared remarks; Micron SEC filings; Micron management commentary at the August 2026 KeyBanc conference; S&P Global Ratings; public analyst commentary and estimates from Morgan Stanley, Barclays, UBS, Bernstein and Morningstar; and the Japan Stock Alpha Micron valuation model. Company-reported facts, analyst estimates and Japan Stock Alpha assumptions are treated separately in the article.
Research tool used in this analysis
Fiscal.ai was used as one of the research tools for collecting and reviewing financial data, company filings, earnings materials and segment information for this deep dive. We independently review the assumptions and check material figures against official company disclosures.
JSAJAPAN
15% off on all payments within the first 11 months.
Disclosure: This is an affiliate link. Japan Stock Alpha may earn a commission at no extra cost to you. Always verify material figures against the company’s latest official filings.
For informational purposes only. This is not investment advice or a recommendation to buy, sell or hold any security. The $940.76 share price is a dated comparison point from 18 August 2026, not a live quote. FY27–FY31 revenue, gross margin, EPS, free-cash-flow forecasts, DCF outputs, cycle-average P/E values and sensitivity cases are Japan Stock Alpha estimates. Memory pricing, AI demand, HBM mix, supply additions, China capacity, technology execution, capital expenditure, interest rates and market valuation multiples can change materially. Always verify company-reported figures against Micron's latest official filings and conduct your own research.