
U.S. Power · AI Infrastructure
Bloom Energy —
the best way to play AI power scarcity, or a stock already pricing it in?
The market opportunity looks durable. The harder question is how much of that value Bloom can keep.
A recent Pelosi-linked trade put Bloom Energy on my radar. So I took a closer look at what the market is actually pricing in at $217.
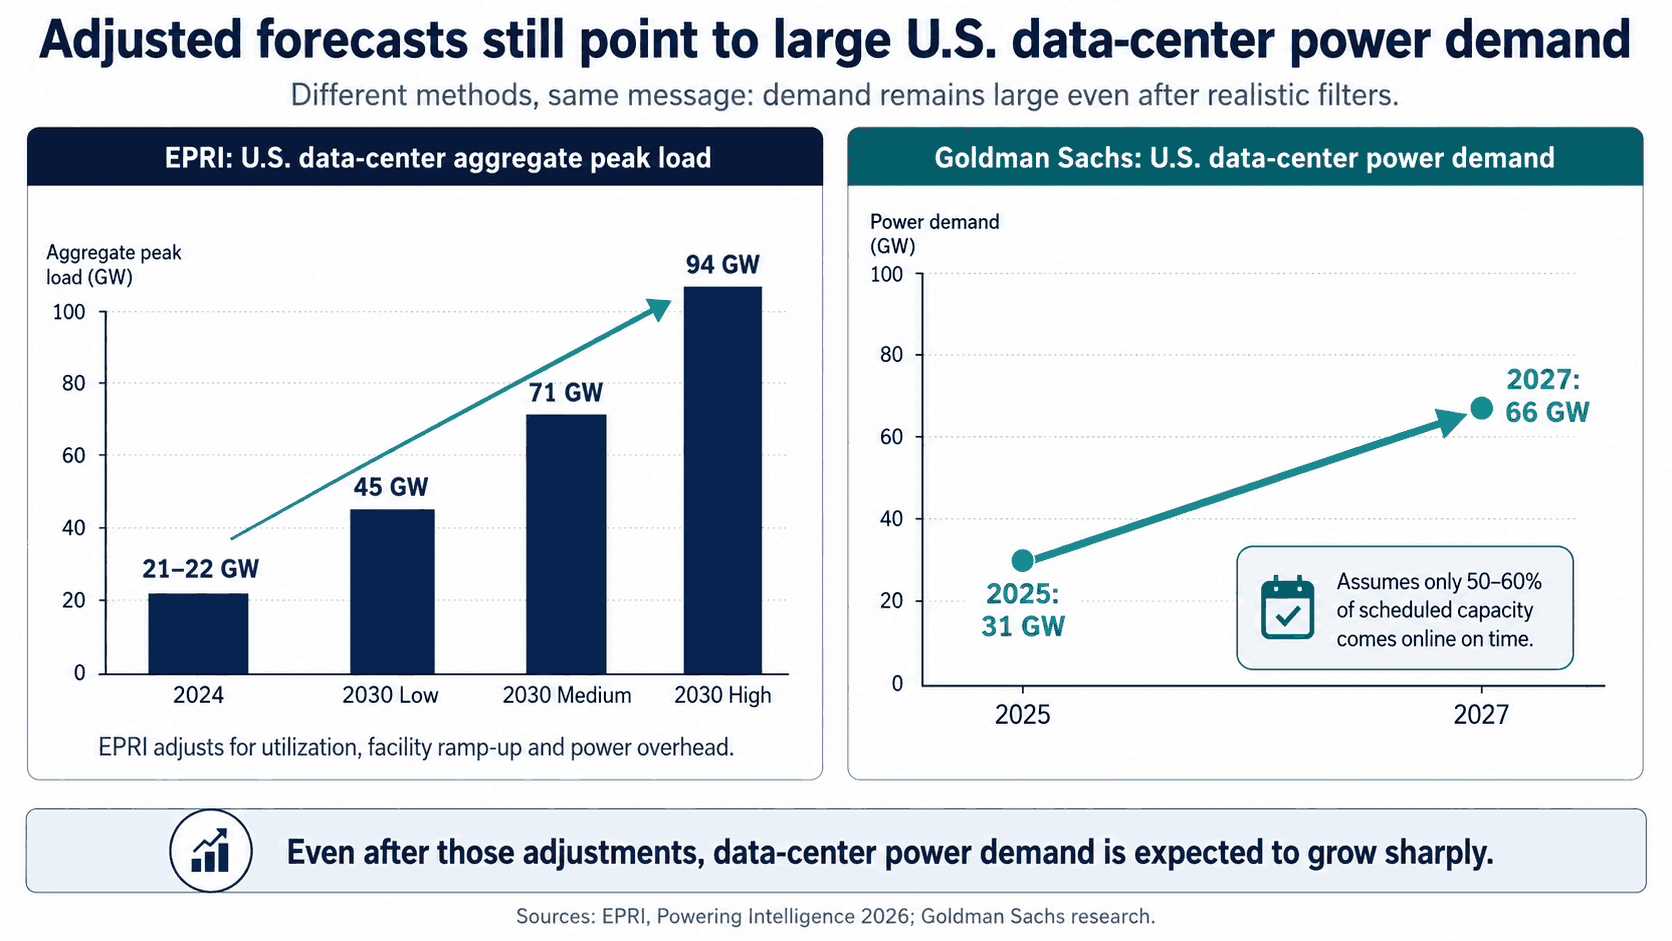
Even after realistic project filters, U.S. data-center power demand is expected to grow sharply.
The key question is not only how much faster Bloom is than the grid, but how much faster it remains than competing onsite solutions.
2028–30 looks more like convergence than a cliff: competition increases, but power scarcity does not simply disappear.
The business looks increasingly real. But at the current price, I would prefer to stay on the sidelines.
1. Investment Conclusion
The more I study Bloom Energy, the more constructive I become on the market opportunity.
I remain more cautious on the stock.
The problem Bloom is solving is simple:
Bloom has already converted that problem into major commercial wins. Oracle has contracted an initial 1.2GW, under a master agreement supporting up to 2.8GW, and Bloom says its first Oracle system was fully operational in just 55 days.
My original concern was that grid buildout and conventional generation might catch up around 2028–30 and sharply reduce the opportunity.
After pressure-testing demand and supply, that now looks too binary.
The more likely outcome is:
The market can remain attractive even as Bloom’s relative advantage narrows.
The more I look at Bloom, the more interesting I find the business itself.
The stock is a different question. At $217, I am not sure there is enough upside to justify buying aggressively.
2. The Data Center Power Bottleneck
Even relatively conservative forecasts point to rapid growth in data-center electricity demand.
EPRI estimates U.S. data-center aggregate peak load could rise from roughly 21–22GW in 2024 to 45–94GW by 2030. Goldman Sachs expects U.S. data-center power demand to increase from 31GW in 2025 to 66GW in 2027, despite assuming that only around 50–60% of scheduled capacity comes online on time.
These forecasts already make important adjustments. EPRI accounts for utilization, facility ramp-up and power overhead, while Goldman discounts projects that may be delayed or cancelled.
AEP Ohio shows why that filtering matters. More than 30GW of prospective data-center requests fell to 5.64GW once binding contracts and collateral were required. Yet including previously contracted projects, AEP Ohio still had 17.86GW of contracted data-center load scheduled progressively through 2035.
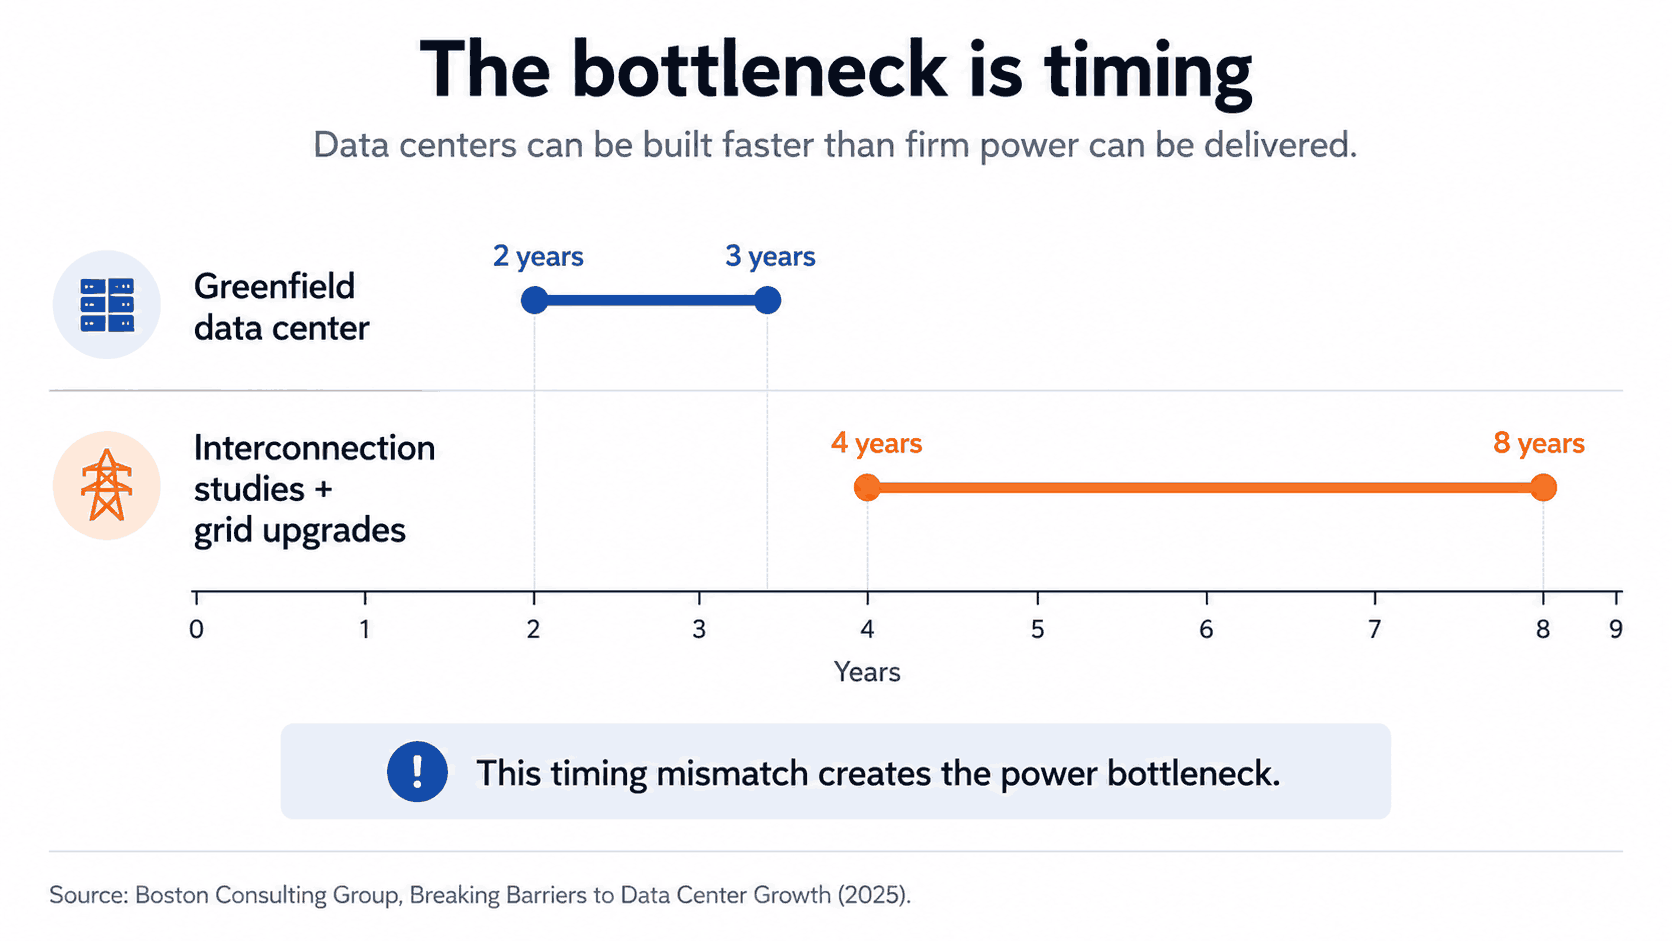
The problem is that power infrastructure cannot be added at the same speed.
A typical greenfield data center can be developed in roughly 2–3 years, while associated interconnection studies and grid upgrades often take 4–8 years.
3. What Bloom Actually Sells
Bloom is primarily a distributed power equipment company, not an IPP.
Q2 2026 Product Revenue was $935m out of $1.065bn total revenue, or roughly 88%. Its Energy Servers use solid oxide fuel cells to convert natural gas into electricity electrochemically rather than through conventional combustion.
For AI data centers, the attraction is the combination of modularity, footprint, emissions profile, water use and deployment speed.
Bloom is not primarily selling the cheapest electricity.
It is selling:
That speed can justify higher electricity costs if it gets billions of dollars of compute online sooner.
4. Two Timing Gaps Matter
I think about Bloom through two simple timing gaps.
1. Grid gap — Utility ΔT
How much faster is Bloom than firm utility power?
If the grid arrives in three months, Bloom has limited economic value.
If it arrives three years later, the economics can look very different.
For a 100MW data center at a 95% load factor:
| Bloom power premium | Annual extra cost | 10Y NPV @ 8% |
|---|---|---|
| +3¢/kWh | ~$25m | ~$168m |
| +5¢/kWh | ~$42m | ~$279m |
If several billion dollars of GPUs can start earning years earlier, that premium may be rational.
But the grid gap only explains why a customer might want onsite power.
It does not explain why the customer needs Bloom.
2. Competitive gap — Competitive ΔT
How much faster is Bloom than the next-best solution?
Suppose:
- Utility power: 2030
- Bloom: 2027
- Gas engines: mid-2027
Bloom is three years faster than the grid — but only six months faster than gas engines.
That is a very different pricing proposition.
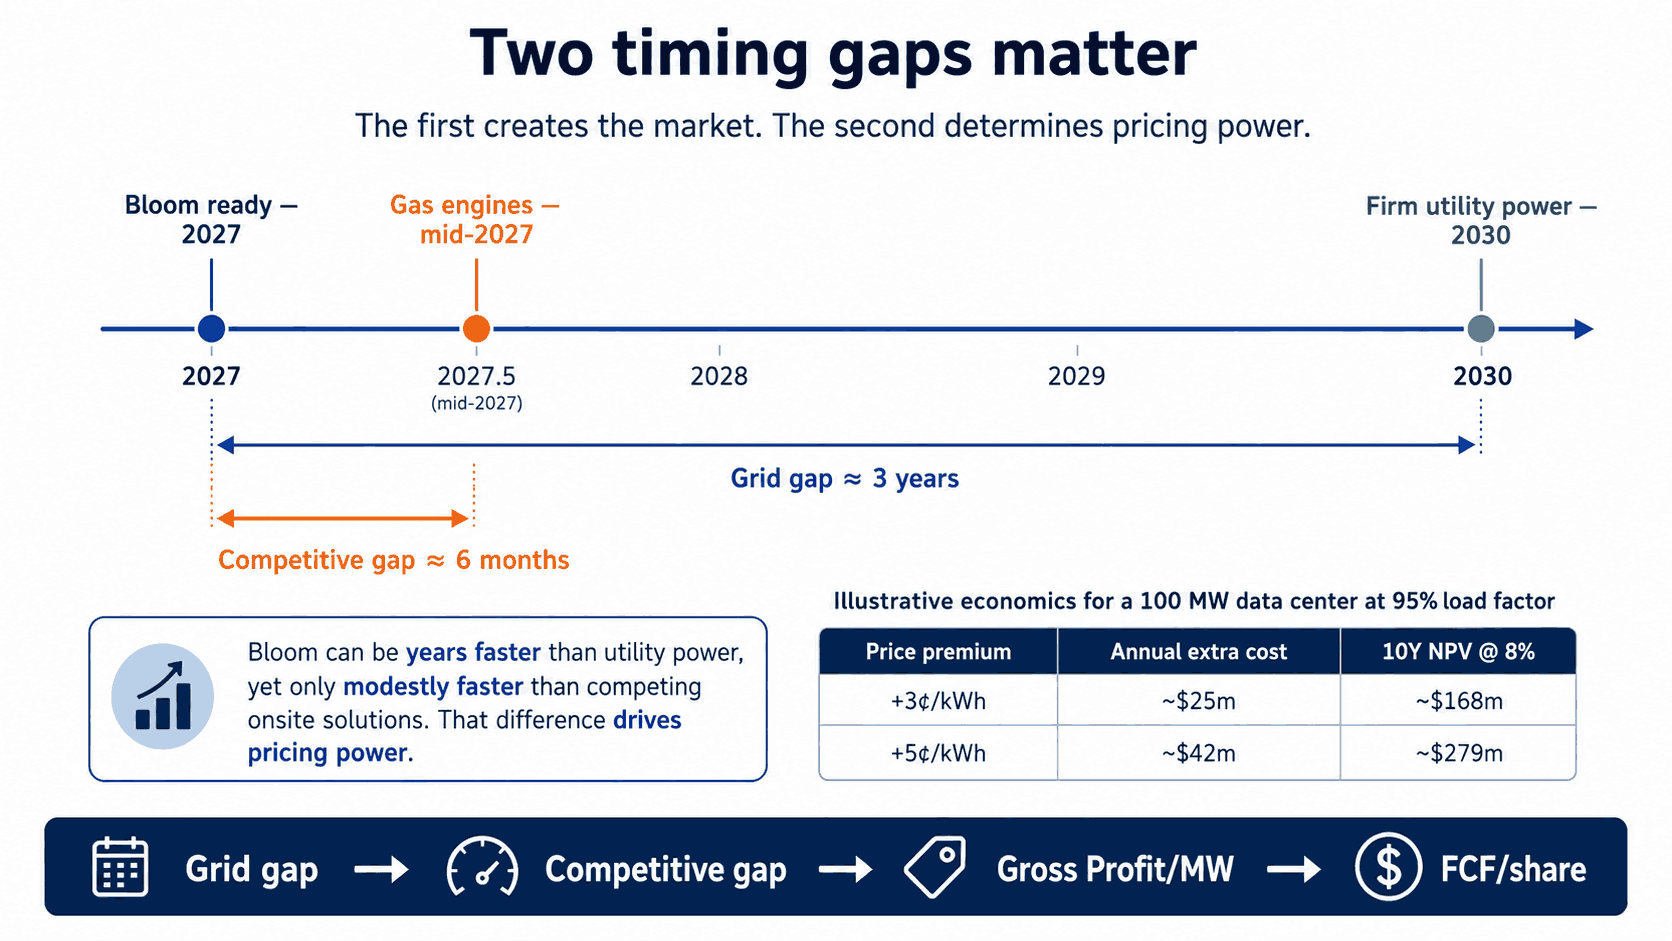
The first creates the market. The second determines how much of that value Bloom can keep.
5. What the Real Projects Tell Us
Three projects are particularly useful.
| Project | What it tells us |
|---|---|
| AEP / AWS Hilliard | The grid timing problem is real |
| Oracle | Bloom can win at hyperscaler scale |
| Nebius | Bloom can beat a combustion-based alternative |
Hilliard
An adjacent data center has an initial 328MW load that can be supplied through transmission enhancements. But for additional expansion, AEP describes a 72.9MW Bloom system as a bridge until new transmission infrastructure may arrive 7–10 years later.
That is strong evidence of a real grid timing gap.
It does not tell us how much faster Bloom was than every alternative.
Oracle
Oracle has contracted 1.2GW, with the broader agreement supporting up to 2.8GW.
But the economics matter as much as the MW. Bloom’s Oracle-related warrant and inducement shares carried an aggregate fair value of $324.4m, recognized as customer consideration over deliveries.
So the metric I care about is not simply Revenue/MW.
Nebius
Nebius announced a 328MW Bloom deployment planned to become operational during 2026 and said Bloom replaced previously planned combustion-based technology, explicitly citing fast Time-to-Power.
That is more directly relevant to Bloom’s competitive advantage.
Separately, Nebius’s Independence campus is planned around 800MW of utility-backed power and 400MW of onsite generation. McKinsey’s industry survey also suggests onsite generation could remain after grid access improves: 65% of respondents expected some form of onsite power, while nearly 60% expected permanent onsite generation to remain by 2030.
That raises an important possibility:
But a durable market for onsite power does not necessarily mean durable economics for Bloom.
6. 2028–30: Convergence, Not a Cliff
The key question is whether competing solutions become available fast enough to narrow Bloom’s speed advantage.
The supply response is already meaningful:
| Competing supply | Evidence |
|---|---|
| INNIO gas engines | ~4.9GW of disclosed major DC-related orders; 1.5GW tranche due by 2028 |
| Wärtsilä gas engines | >2.4GW sold into U.S. DCs; 790MW Texas project gets equipment in 2028 |
| GE Vernova turbines | 116GW backlog/slot reservations; annual output targeted at 30GW by 2030 |
| Siemens Energy turbines | Sold out through FY2028; 2029–30 slots already filling |
| Grid-side generation | PJM fast-tracked 7.9GW; MISO ERAS has ~28GW proposed, ~11GW with completed GIAs |
These figures should not be added together — they measure different things. What they establish is direction:
But it is not abundant yet.
Siemens remains booked years ahead, Wärtsilä is allocating equipment several years forward, and Berkeley Lab finds that projects reaching operation in 2025 still took more than five years from interconnection request to COD on median. Historically, only 13% of capacity entering queues from 2000–20 had reached commercial operation by the end of 2025.
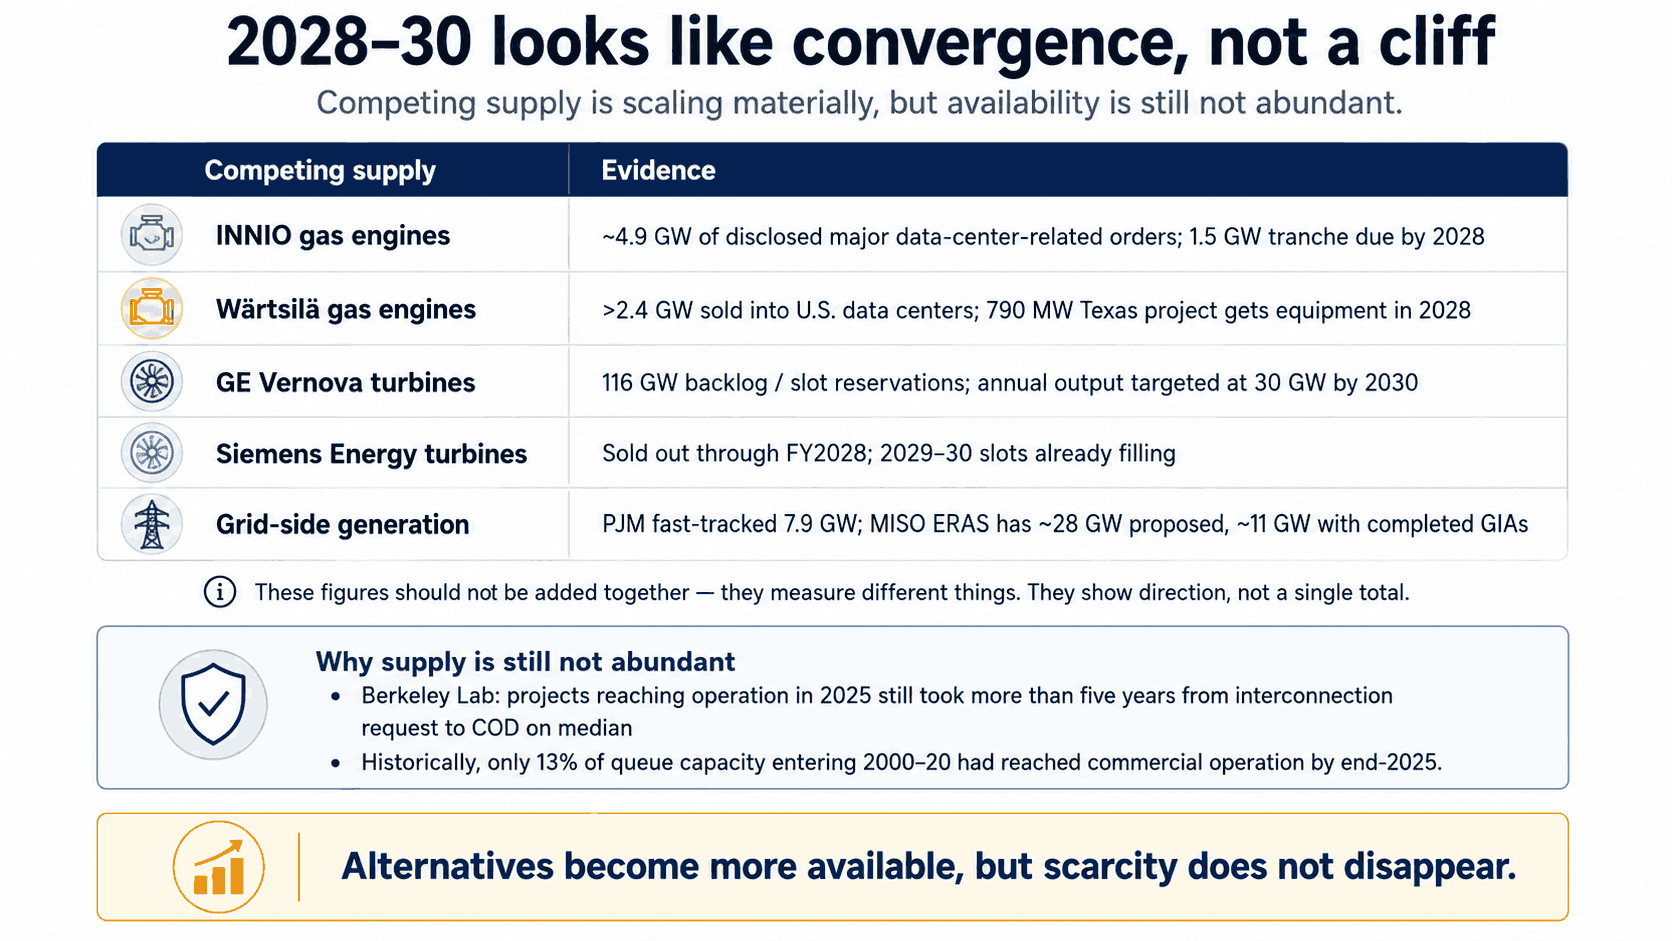
So 2028–30 looks less like a cliff and more like convergence:
That means Bloom can continue growing while its relative speed advantage narrows.
Competition does not need to stop Bloom’s revenue growth. It only needs to reduce pricing power, increase customer incentives and push Gross Profit/MW lower.
7. Valuation
At around $217, Bloom already prices in a meaningful amount of future success.
The current average analyst price target is approximately $275, or about 27% above the reference price.
Separately, current FactSet operating consensus assumes a strong trajectory:
| 2026E | 2027E | 2028E | 2029E | 2030E | |
|---|---|---|---|---|---|
| Revenue | $4.1bn | $6.7bn | $9.8bn | $12.7bn | $15.8bn |
| FCF Margin | — | — | ~17% | ~21% | ~25% |
Long-dated estimates naturally become less reliable, but the direction is clear: consensus assumes both rapid growth and significant improvement in cash economics.
The opportunity is clearly large. What looks harder to underwrite is the combination of continued revenue growth and sustained margin expansion.
As gas engines, turbines and grid capacity become more available, Bloom’s Time-to-Power advantage should gradually narrow. That could put pressure on both Revenue/MW and Gross Profit/MW.
Today, customers are paying partly for Bloom’s ability to deliver power years earlier than the grid.
If that timing advantage narrows, the market should gradually shift from:
That matters because while the power solution itself can be differentiated, the end product — electricity — is relatively substitutable once reliability and other requirements are met.
The consensus scenario is possible.
But in my view, the execution bar is high.
For now, I would prefer to stay on the sidelines at the current price.
What I Would Watch
Three metrics matter most:
Everything ultimately flows into FCF per share.
Final Take
The pressure test made me more confident in the market, and more convinced that Bloom has a real role to play in it.
Power scarcity likely persists into 2030, while competing solutions gradually narrow Bloom’s speed advantage.
That makes Gross Profit/MW the metric I care about most.
The opportunity is real, but current analyst expectations already assume a very strong combination of growth and improving cash economics.
I think that outcome is possible.
I am simply not confident enough that Bloom can preserve today’s Time-to-Power advantage — and the economics that come with it — to buy aggressively at the current price.
Bloom Energy Q2 2026 earnings materials and company disclosures; Oracle-related commercial disclosures; AEP Ohio data-center load and Hilliard project materials; Nebius project disclosures; EPRI; Goldman Sachs research; Boston Consulting Group; McKinsey; INNIO; Wärtsilä; GE Vernova; Siemens Energy; PJM; MISO; Berkeley Lab; MarketScreener analyst consensus; and FactSet operating estimates. Long-dated analyst estimates are inherently less reliable and should be treated as directional rather than precise forecasts.
For informational purposes only. This is not investment advice or a recommendation to buy, sell or hold any security. The $217.45 share price is a dated comparison point from 25 August 2026, not a live quote. Analyst price targets and operating estimates can change materially. Data-center demand, utility interconnection timing, competing generation supply, fuel availability, pricing, customer incentives, margins, capital intensity, dilution and market valuation can all differ materially from the assumptions discussed here. Always verify material figures against the latest official company filings and conduct your own research.